Reports & Analysis
Envitech Ltd EnvistaWeb site offers several type of reports including dozens of textual and various graphical reports that are the most powerful tool of data management for air monitoring AQM/CEM sites. Some of the reports available only for registered users after typing correct and allowed username & password in the login process.
The following reports available from the Reports menu in the Envitech Ltd EnvistaWeb site:
- Station Data Report –Standard tabular and graphical reports for AQM/CEM Station values. Day, week, month and user defined (periodic) report intervals are supported. Stored data values may be averaged before being reported. Values reported may be filtered.
- Monthly Matrix - Monthly Summary by Hour and by Day
- 2Y Time Plot - Two parameters plotted against time.
- XY Time Plot – Correlation between two parameters.
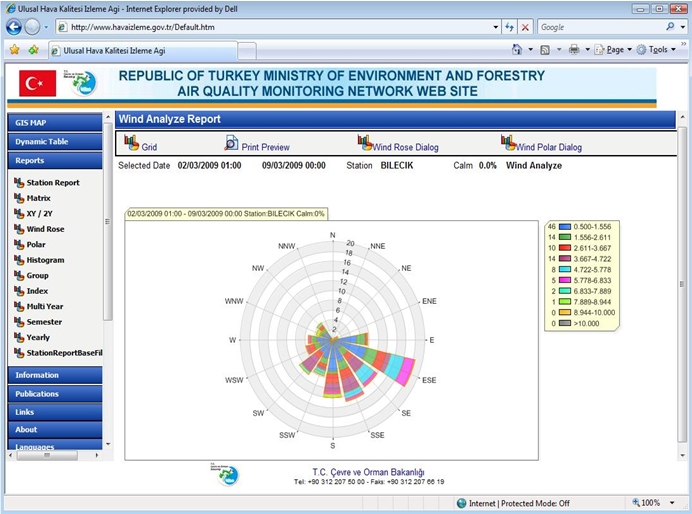
- Wind & Pollution Rose - Joined pollution concentration, wind direction and Speed relative frequency.
- Group - Report that reflects a group of monitors related to one or more AQM/CEM stations as set up by the user.
- Histogram - The frequency of occurrence for various ranges of a monitor’s value.
- Index - Performance of the Air Quality Indexes value for a station or several AQM/CEM stations.
- Semester Report - Monitor's daily data for each month in the semester.
- Yearly Report - Yearly data from three types: Quarter, event and air quality index.
- Multi-Year Report - Yearly data as a function of years/groups of monitors from three types: Average, percentile and exceedance.
- Percentile Report - Reflects selected percentile monitors data or number of records above/below specific value.
- Multi-Year Report - Data report for several monitors from different AQM/CEM stations.
- Edit History Report - Table that reflects the edited values that were manipulated on the data base tables.
The Envitech EnvistaWeb site user can select the following analysis features:
- Analysis period of day, week, month, or year.
- Average Type Mean, Running, Running Forward,Maximum and Minimum.
- Data average interval of 1min,5min,6min,10min,15min,30min,1hr,3hr,6hr,8hr,12hr, or 24hr.
- Output to display, printer, or file (XLS, WMF, JPG and BMP format).
Operational Reports are further reports that deals mainly in the hardware computers and devices and technical aspects of the Envitech Ltd Envista air monitoring system. the following Operational Reports available:
- Alerts Report - History of alerts in the AQM/CEM sites.
- Calibration Report - Information about the calibration data in the system. Including 6 types of reports.
- Log Book Report - Display technician logbook related to the stations after regular or random tests.
- Communication Report - Display failure communication events.
- Missing Data Report - Display periods of lack of data.
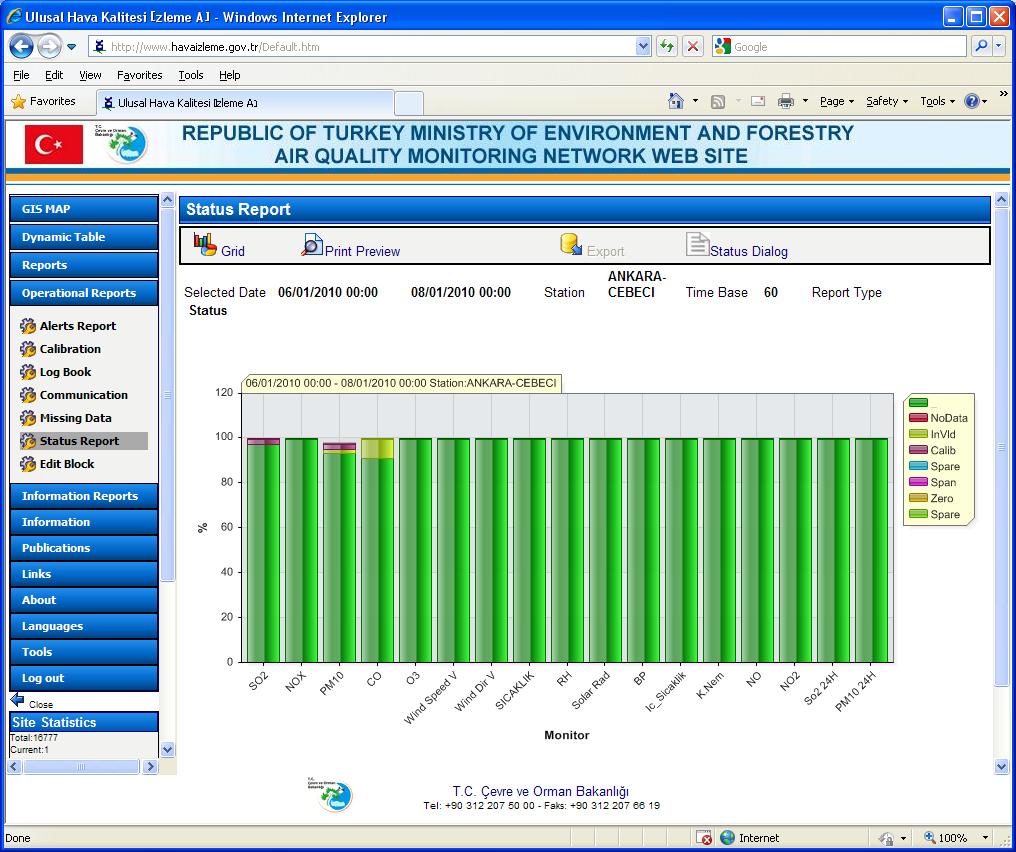
- Status Report - Display selected monitors statuses in percents (graphic and tabular presentation).
- Edit Block - Let the permitted user (editor or supervisor) to edit block of data records.
- Events Report - Display the events that were exceeded above/below typed numeric value.

Information Reports including some tabular informative reports about the stations, monitors, contact personnel and regions. The Envitech Ltd EnvistaWeb site information Reports are:
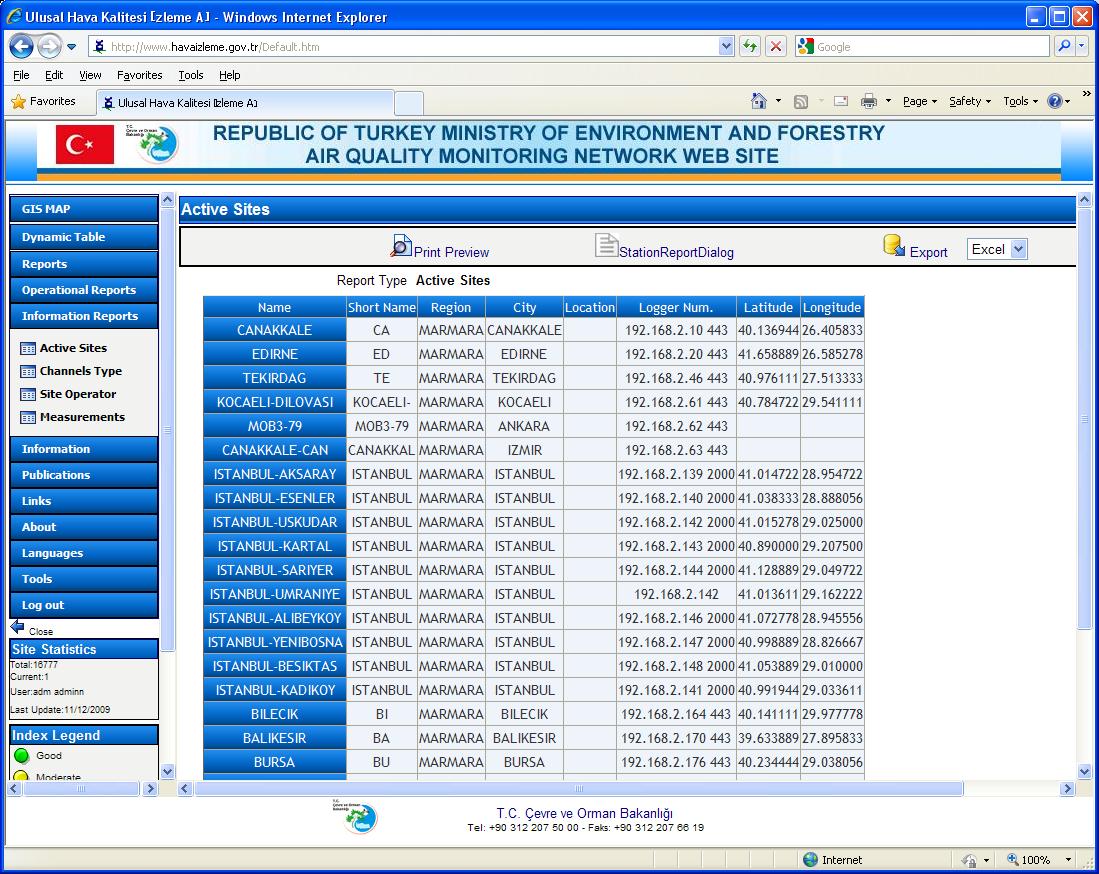
- Active Sites - Information about the AQM/CEM stations.
- Channels Type - Information about the monitors of the stations.
- Site Operator - Information about the personal details of the contact personnel that related to the stations.
- Measurements - Information about the stations-monitors relations.

